50 Years of Mortgage Rates – The Current Rate is Below Average


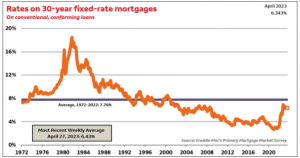
 Mortgage rates have increased since 2021 but they are still lower than the 50-year average. The current rate today is 6.39% which is much lower than the 50-year average rate of 7.76%
If you want a real shocker, look at the early 1980s in the table below. Many of us “Vintage” folks had to deal with those rates.
Houses that are priced, presented & marketed correctly are selling fast.
Let my 32+ years of Real Estate experience in Las Vegas work for you. 702-378-7055
Mortgage rates can be influenced by a variety of factors, including inflation, economic growth, monetary policy decisions by the Federal Reserve, and the supply and demand for mortgage-backed securities in the financial markets. Generally, when inflation is high and the economy is growing, mortgage rates tend to rise as lenders demand higher returns to compensate for the increased risk of inflation eroding the value of their loans. Conversely, during times of economic recession, mortgage rates may fall as the demand for credit decreases, and the Federal Reserve may lower interest rates to encourage borrowing and stimulate economic growth.
Last Weeks Rate:
- The 30-year fixed-rate mortgage averaged 6.39 percent as of May 4, 2023, down from last week when it averaged 6.43 percent. A year ago at this time, the 30-year FRM averaged 5.27 percent.
- The 15-year fixed-rate mortgage averaged 5.76 percent, up from last week when it averaged 5.71 percent. A year ago at this time, the 15-year FRM averaged 4.52 percent.
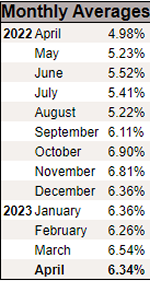
A snapshot of the last 16 months
A table of average mortgage rates per year from 1972 through 2022, we use data provided by Freddie Mac, a government-sponsored enterprise that tracks mortgage rates. Here is a table showing the average 30-year fixed-rate mortgage rates for each year since 1972:
| Year | Average Rate |
|---|---|
| 1972 | 7.38% |
| 1973 | 8.04% |
| 1974 | 9.19% |
| 1975 | 9.05% |
| 1976 | 8.87% |
| 1977 | 8.53% |
| 1978 | 9.64% |
| 1979 | 11.20% |
| 1980 | 13.74% |
| 1981 | 16.63% |
| 1982 | 16.04% |
| 1983 | 13.24% |
| 1984 | 13.88% |
| 1985 | 12.43% |
| 1986 | 10.19% |
| 1987 | 10.21% |
| 1988 | 10.34% |
| 1989 | 10.32% |
| 1990 | 10.13% |
| 1991 | 9.25% |
| 1992 | 8.39% |
| 1993 | 7.31% |
| 1994 | 8.38% |
| 1995 | 7.93% |
| 1996 | 7.81% |
| 1997 | 7.60% |
| 1998 | 6.94% |
| 1999 | 7.44% |
| 2000 | 8.05% |
| 2001 | 6.97% |
| 2002 | 6.54% |
| 2003 | 5.83% |
| 2004 | 5.84% |
| 2005 | 5.87% |
| 2006 | 6.41% |
| 2007 | 6.34% |
| 2008 | 6.03% |
| 2009 | 5.04% |
| 2010 | 4.69% |
| 2011 | 4.45% |
| 2012 | 3.66% |
| 2013 | 3.98% |
| 2014 | 4.17% |
| 2015 | 3.85% |
| 2016 | 3.65% |
| 2017 | 4.03% |
| 2018 | 4.54% |
| 2019 | 3.94% |
| 2020 | 3.11% |
| 2021 | 3.03% |
| 2022 | 5.34% |

