Las Vegas Housing Market Statistics For November- Declining Prices Good For Buyers

 While I’m waiting for the President and The Treasury Secretary to unveil the details of their “bail out†plan for sub prime mortgages, which is not without controversy, I’ll give you the dismal stats for November from the Greater Las Vegas Association of Realtors as well as some links to a few recent articles in the RJ.
If you like charts and graphs about the Las Vegas Housing Market
Number junkies will be in heaven looking at all the charts, but us regular people can really get a feel for things with just a casual glance at the charts.
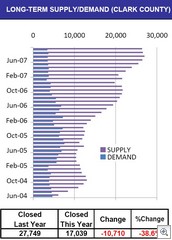
The chart at the left paints the picture pretty well. Supply and Demand, as we learned in High School is what drives prices up or down. The contraction in the middle of the chart correlates EXACTLY to the big run up in prices in 2005, and the current supply and demand at the top of the chart is what’s driving prices down now.
I’m seeing lots of frustrated sellers, especially those who bought in 2005 deciding once again to rent out the homes, or to just stay put. This has caused a small decline in the inventory, and the absorption of all the foreclosures by savvy investors and buyers will start cause the supply numbers to come down. If the Treasury Departments plan works, it should keep another 10,000 or so homes in Las Vegas from going into foreclosure, and becoming part of the oversupply in 2008.
The RJ has a very good article on 12/2 about how current homeowners can take advantage of the market conditions to trade up to a bigger or better home, or a better neighborhood. And it’s certainly true that first time qualifyable buyers can take advantage of the housing slump as long as they do it smart, and they do it with at least a 3 year, if not 5 year or more time frame.
The bottom line, is supply and demand are out of balance with each other, and buyers buying, and reducing the inventory from sales, or withdrawals, or reduced necessity to sell, will put the market back into balance.
The Las Vegas Housing Statistics from Greater Las Vegas Association Of Realtors is a pdf that you can down load or view.
Equity Title further digests the data and puts the Las Vegas Home Sales Numbers into graphs and charts that might be easier to read. It’s also a PDF that you can down load or just view.
Tags: home+prices, equity+title, greater+las+vegas+association+of+realtors, jack+levine, uncle+jack
.


